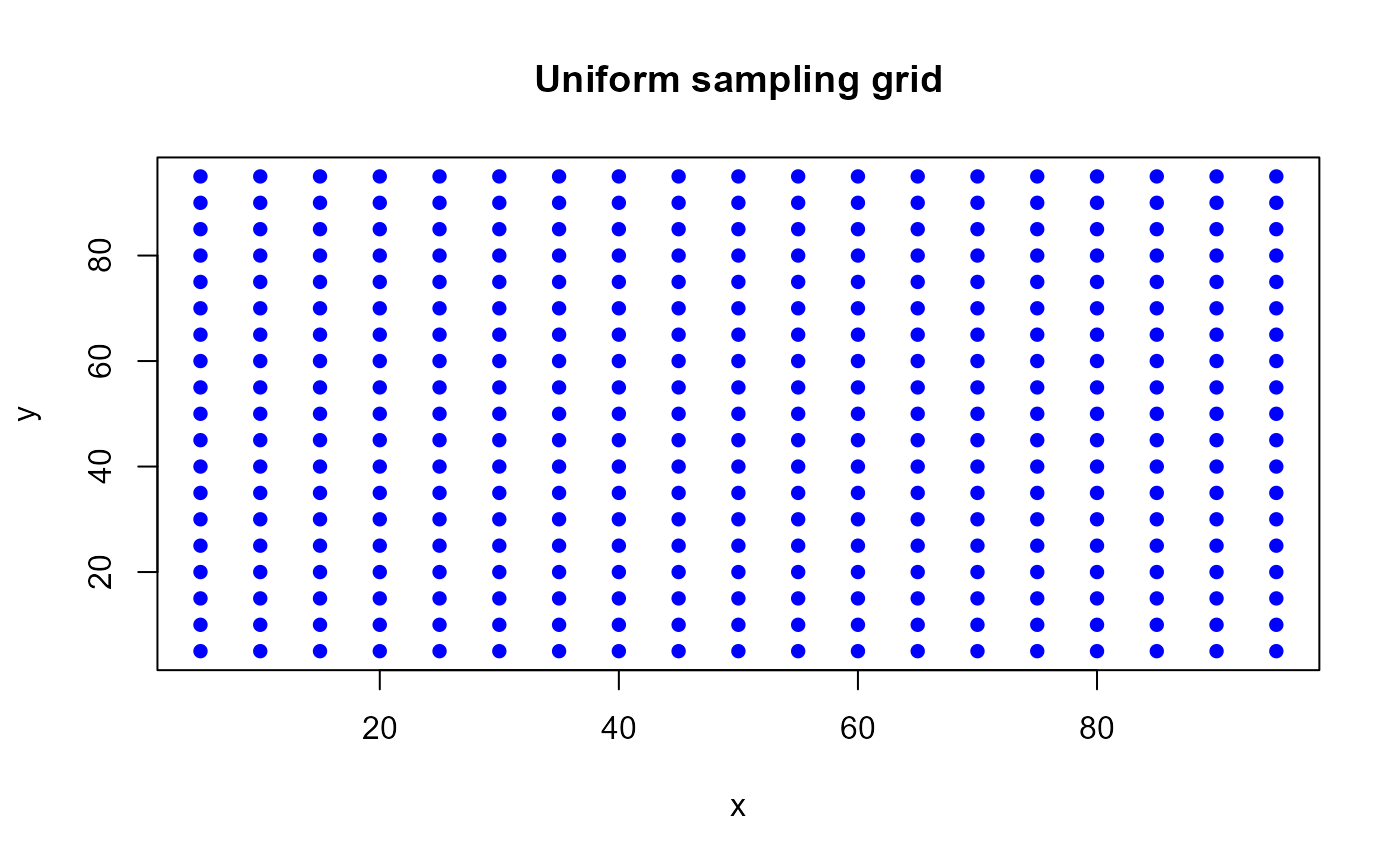
Establish sampling points as a grid defined by X and Y ranges and a specified cell size.
uniformSamp(xrange, yrange, cellsize)
Arguments
- xrange
Vector of two elements idnicating x coordinates range (min,max).
- yrange
Same as above for y range.
- cellsize
Cell size for grid (minimum dist between points)
Details
Value
Returns a table of coordinates of the sampling sites.
References
Author
Note
Examples
# Create uniform sampling grid in a 100x100 grid.
sampling <- uniformSamp(c(0,100), c(0,100), 10)
plot(sampling, pch = 16, col = "blue",
     xlab = "x", ylab = "y",
     main = "Uniform sampling grid")