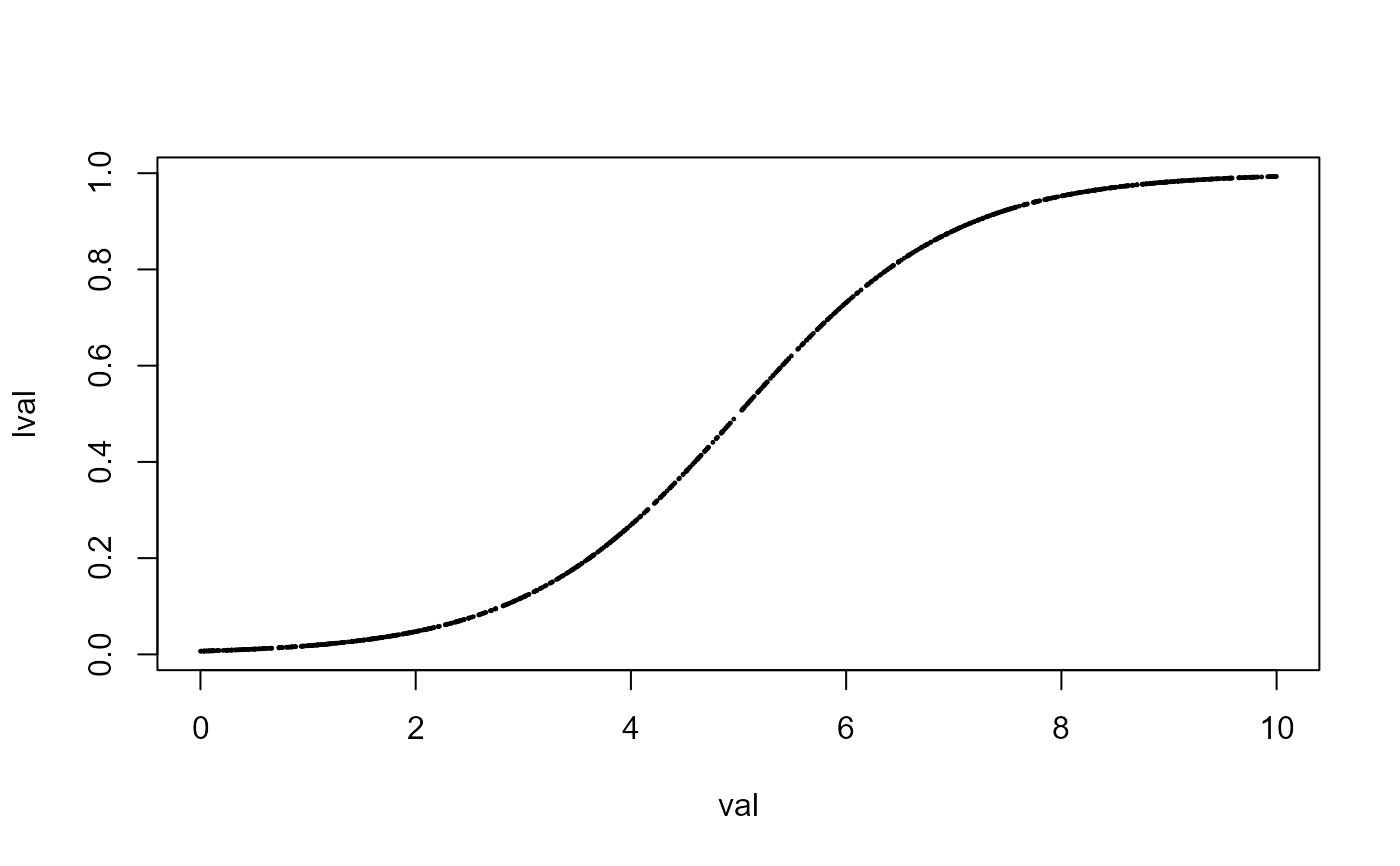
Logistic function of data.
logistic.RdTransforms the data with a logistic function.
logistic(x, x0, L, k)Arguments
Details
Value
Returns a transformed object of same data type as x.
logistic.RdTransforms the data with a logistic function.
logistic(x, x0, L, k)Returns a transformed object of same data type as x.