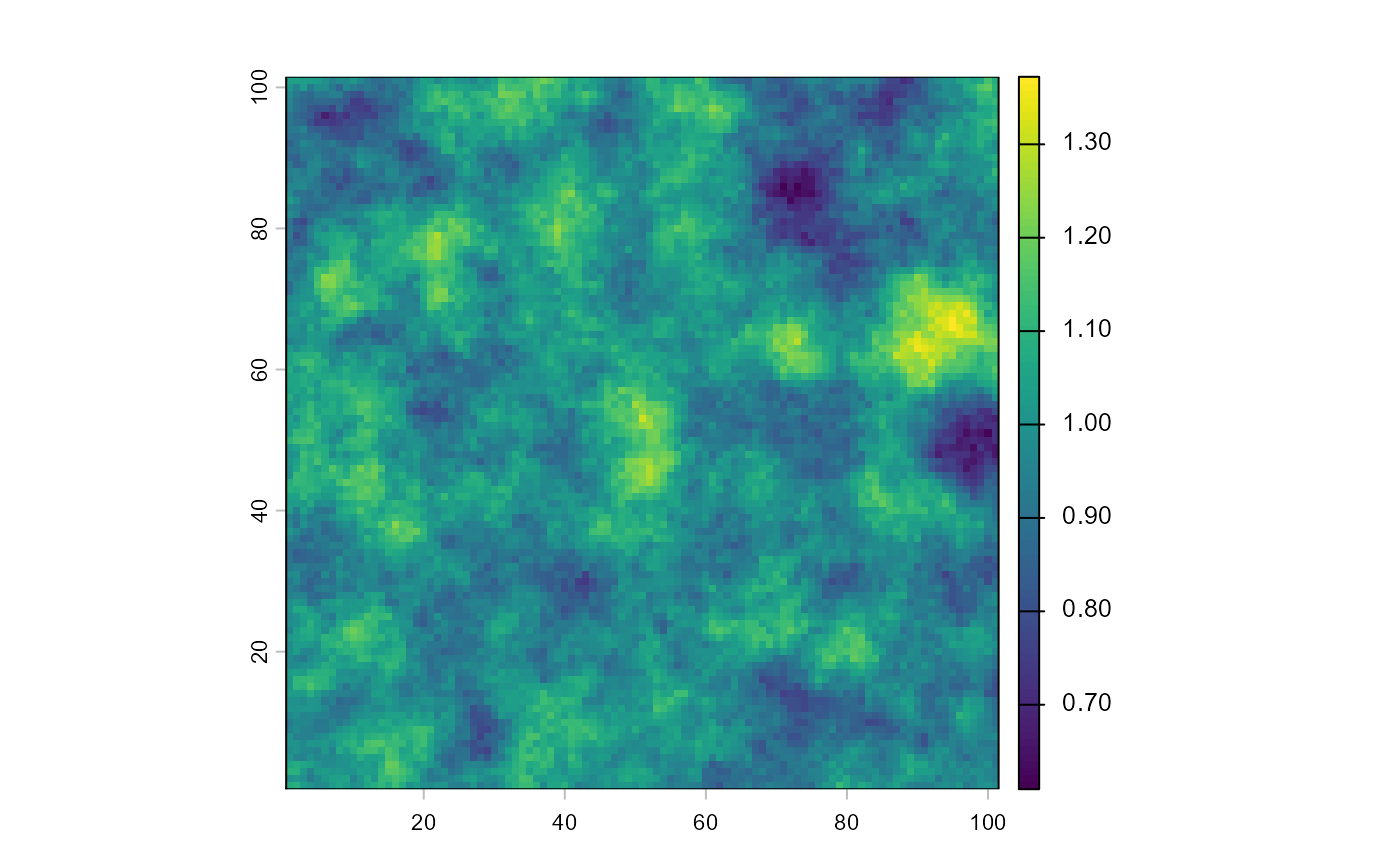
Generates a simple autocorrelated variable data with Gaussian simulations with Spherical model.
generateVar.RdGenerates a new variable data with Gaussian simulations with Spherical model where we can control some parameters of this variables (mean, deviation and spatial autocorrelation). Can be used, for instance, to create a variable simulating and spatially aggregated patter as vegetation patches.
generateVar(nrow, ncol, Vmean, Vsd, Vrange)Arguments
Details
Value
Returns a data frame with generated grid coordinates and values generated.