Generates monthly data based on annual precipitation values.
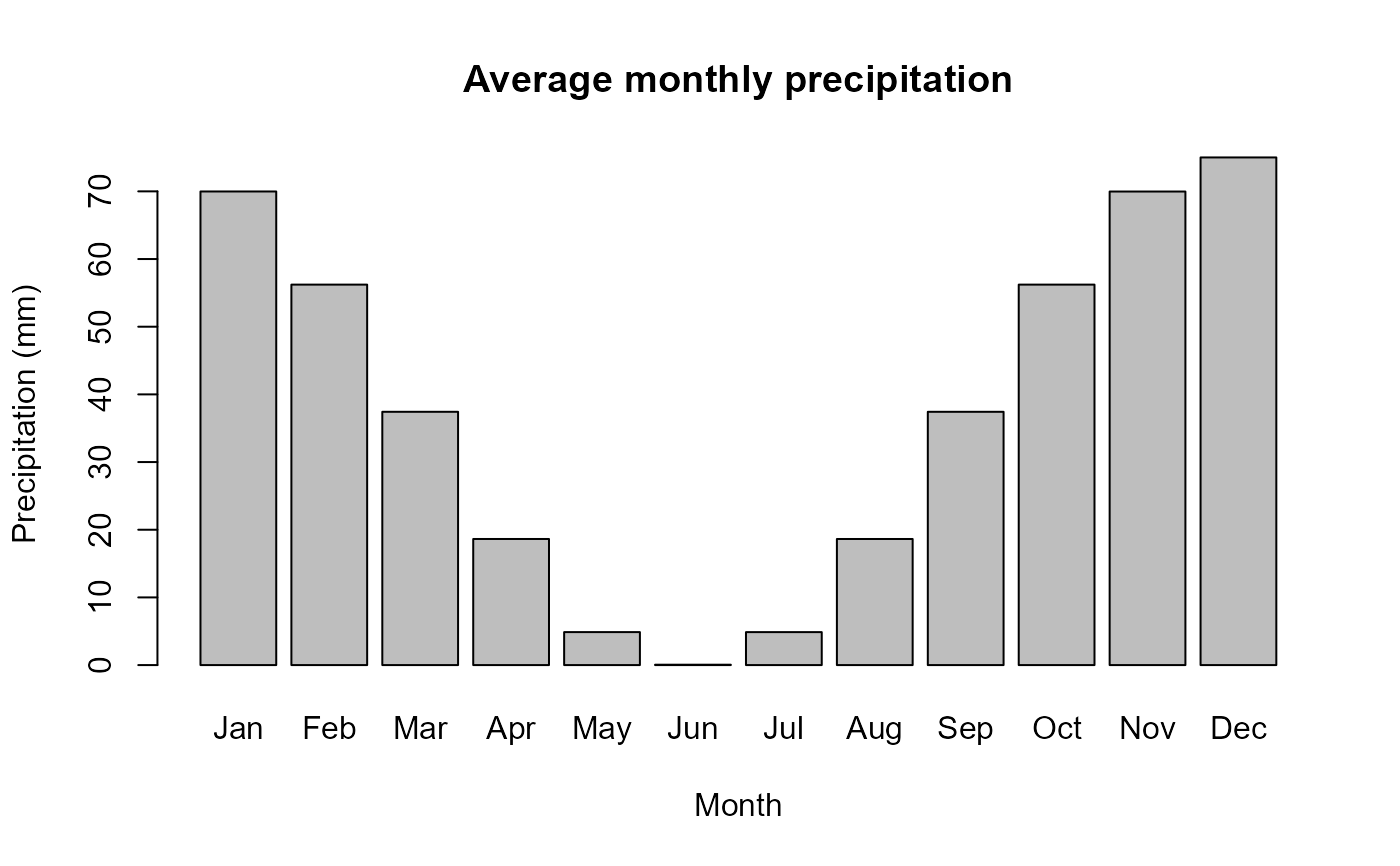
generateMonthlyPrec.RdGenerates monthly data derived from annual precipitation values. The generation process occurs for each month, incorporating a simple cosivariation-derived seasonality pattern with a low peak during summer (July-August), plus a spatially independent normal error. Monthly data is a decomposition of annual values, weighted by the corresponding variation.
generateMonthlyPrec(x, annual_var, err_sdev = 0.1)Arguments
Details
Value
Returns a matrix with monthly precipitation data for each cell(rows) and for each month (columns).
References
Note
See also
Examples
set.seed(1234)

m_prec <- generateMonthlyPrec(clim$prec, clim$prec_variation)


# Generate base climate data
clim <- generateClim()
#> [using unconditional Gaussian simulation]
#> [using unconditional Gaussian simulation]
#> [using unconditional Gaussian simulation]

# Generate monthly precipitation for each cell
m_prec <- generateMonthlyPrec(clim$prec, clim$prec_variation)

# Average precipitation per month across all cells
monthly_avg <- colMeans(m_prec)
barplot(monthly_avg, names.arg = month.abb,
          xlab = "Month", ylab = "Precipitation (mm)",
          main = "Average monthly precipitation")